

In this part of our report (previous parts one and two are here), we look at civil judgments rendered by the Intellectual Property Court (“IP Court”) and analyze statistics regarding the value of claims raised, the percentage of such claims awarded in the first instance, the win rate in the first instance, the reversal rate in the second instance, and the settlement rate for patent, copyright, and trademark litigation cases from 2008 through 2019.
Note that in terms of the statistical basis, value of claims raised, and the percentage of such claims granted by the IP Court in the first instance, are calculated in accordance with the dataset provided by the Judicial Yuan at data.gov.tw, which includes only those judgments that are publicly available. Statistics regarding win, reversal, and settlement rates are based on figures published by the Judicial Yuan, which include all cases heard by the IP Court.
Value of Claims
The following charts plot the value of claims raised in copyright, patent and trademark civil litigation from 2008 through 2019, excluding those cases that were closed on procedural grounds.
Median value of claims raised in copyright cases
The median amounts varied significantly in copyright civil litigation during the years from 2008 to 2014. The lowest median amount was in 2011; in which, half of all cases had a claim amount of less than NTD 0.5 million (approx. US$18,000). The median rose to almost NTD 2 million in 2014. From 2015, the trend steadied, with half of all cases in each year through to 2018 having a value of claim less than NTD 1 million. However, the median went down to NTD 0.81 million in 2019.
Median value of claims raised in copyright litigation cases closed from 2008 to 2019
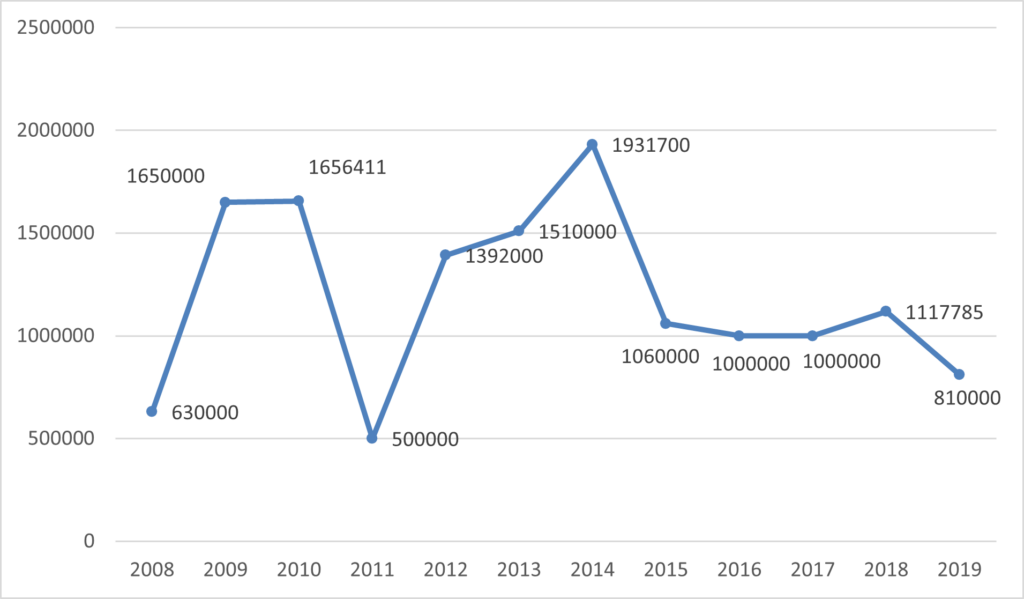
Source:data.gov.tw
Median value of claims raised in patent cases
Turning now to claims raised in patent litigation before the IP Court, the data shows a steady increase in the value of claims since 2008. In 2009, half of the claims were under NTD 1.65 million, while this figure doubled to NTD 3.3 million by 2019. The peak was in 2016 with the median value of claims at NTD 3.9 million. The median has been near NTD 3.3 million in the most recent three years.
It is noted that the median value of claims in patent litigation is higher than that in copyright litigation. In recent years, that ratio is about 3:1.
Median value of claims raised in patent litigation cases closed from 2008 to 2019
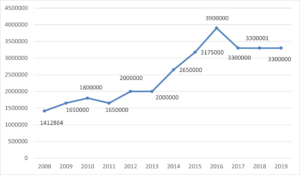
Source: data.gov.tw
Median value of claims raised in trademark cases
The trend for claims in trademark litigation cases is similar that in patent cases. The median value of claims raised in trademark cases has grown steadily from NTD 1.8 million in 2009 to NTD 3.12 million in 2019. With the exception of 2016, the median value of claims in the most recent five years was above NTD 3 million.
Median value of claims raised in trademark litigation cases closed from 2008 to 2019
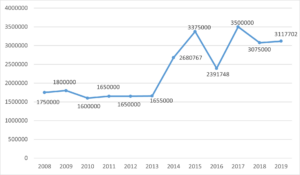
Source: data.gov.tw
In summary, in observing the three main categories of litigation cases, it is clear that the median value of claims in each category has followed a consistent trajectory in recent years. The value of claims in copyright litigation cases is the lowest and has decreased, whereas claims raised in trademark and patent litigation cases are significantly higher and are trending upward.
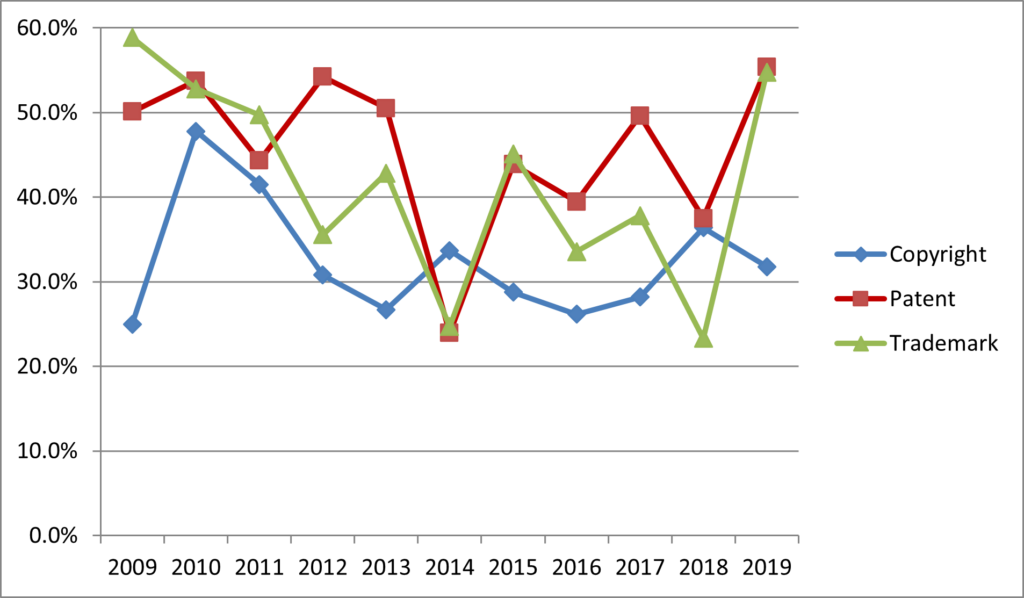
Percentage of claims granted by the IP Court in the first instance
Based on copyright litigation cases in which plaintiffs prevailed in a claim for monetary compensation, the IP Court has, on average, awarded approximately 25% of the value of claims raised by plaintiffs in the first instance.
The data for the three categories of litigation shows that the percentage of claims awarded by the IP Court have been lowest in relation to copyright cases. The awards in copyright litigation for the relevant years never exceeded 50% of the value of claims raised by the plaintiffs. In 2012, plaintiffs on average were awarded only 28% to 35% of the value of claims.
The percentage of claims awarded were highest in patent cases. Except for the lowest point of 23.9% in 2014, the average award exceeded 37% of the value of claims. The percentage reached the highest point in 2019 at 55.4%.
The trend in terms of percentage of claims awarded in trademark litigation is similar to that for patent cases, though the percentage is slightly lower. The data shows a dramatic rise in the percentage of claims awarded from 2018 to 2019, and the percentage has increased from the lowest point of 23.3% to the highest point in the ten most recent years of 54.7%.
Percentages of claims awarded by the IP Court in the first instance in copyright, patent and trademark litigation cases closed from 2009 to 2019
| Copyright | Patent | Trademark | |
| 2009 | 25.0% | 50.1% | 58.9% |
| 2010 | 47.8% | 53.8% | 52.8% |
| 2011 | 41.5% | 44.3% | 49.7% |
| 2012 | 30.8% | 54.2% | 35.5% |
| 2013 | 26.7% | 50.5% | 42.8% |
| 2014 | 33.7% | 23.9% | 24.7% |
| 2015 | 28.7% | 43.9% | 45.1% |
| 2016 | 26.1% | 39.5% | 33.5% |
| 2017 | 28.2% | 49.6% | 37.8% |
| 2018 | 36.4% | 37.5% | 23.3% |
| 2019 | 31.8% | 55.4% | 54.7% |
Source: data.gov.tw
Win rates for plaintiffs in the first instance
Win rates for plaintiffs overall in all civil litigation in the first instance before the IP Court are calculated as follows: total wins (each complete win counted as 1 case; each partial counted as 0.5 case) divided by all cases in which either the plaintiff or the defendants prevailed.
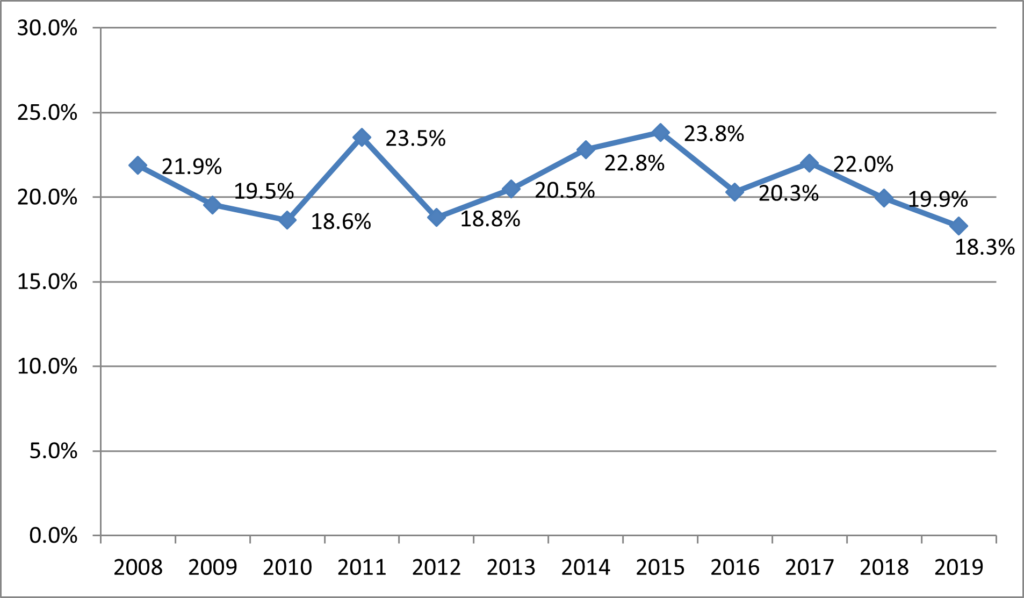
As shown in the chart below, the plaintiff win rate in all civil litigation cases in the first instance remained fairly stable from 2008 through 2019, ranging between approximately 18% and 24%, with a high of only 23.8% in 2015. Furthermore, the win rates have declined 2017 through 2019, reaching a low of 18.3% in 2019.
Win rates for plaintiffs in the first instance in all civil litigation cases closed from 2008 to 2019
Source: Judicial Yuan
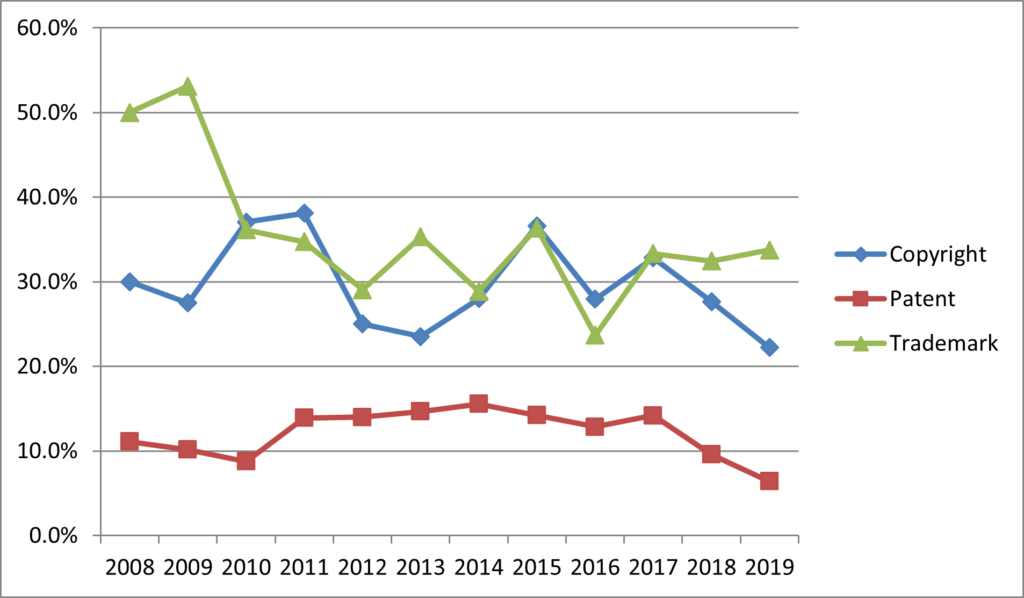
Looking at copyright, patent and trademark cases separately, we see that the win rates for plaintiffs in patent cases have been the lowest among the three categories, with an average of only about 10% every year. After 2017, the patent case win rates fell further, dropping to the lowest point of 6.4% in 2019.
As for copyright and trademark litigation cases, the win rates fluctuated between 25% and 35% in most years of the relevant period, with no obvious gap between those two categories. However, the win rates in copyright cases have declined almost 10% since 2017, declining from 32.8% in 2017 to 22.2% in 2019. The win rates for trademark cases, however, have remained stable at about 33%. We can infer from the data that, from 2017 through 2019, the win rates for plaintiffs in patent litigation have been the lowest, with the win rates in trademark litigation cases being the highest, and copyright litigation win rates for plaintiffs in between the two.
Win rates for plaintiffs in the first instance in copyright, patent and trademark litigation cases closed from 2008 to 2019
| Copyright | Patent | Trademark | |
| 2008 | 30.0% | 11.1% | 50.0% |
| 2009 | 27.5% | 10.1% | 53.1% |
| 2010 | 37.0% | 8.7% | 36.1% |
| 2011 | 38.1% | 13.9% | 34.7% |
| 2012 | 25.0% | 14.0% | 29.0% |
| 2013 | 23.5% | 14.7% | 35.3% |
| 2014 | 28.0% | 15.5% | 28.8% |
| 2015 | 36.6% | 14.2% | 36.4% |
| 2016 | 27.9% | 12.9% | 23.7% |
| 2017 | 32.8% | 14.2% | 33.3% |
| 2018 | 27.7% | 9.6% | 32.4% |
| 2019 | 22.2% | 6.4% | 33.8% |
Source:Judicial Yuan
Reversal rates for appellants in the second instance
The IP Court reversal rate is calculated as follows: all first instance decisions revoked (complete revocation is counted as 1 case; partial revocation is counted as 0.5 case) divided by the total number of appeal cases revoked or dismissed.
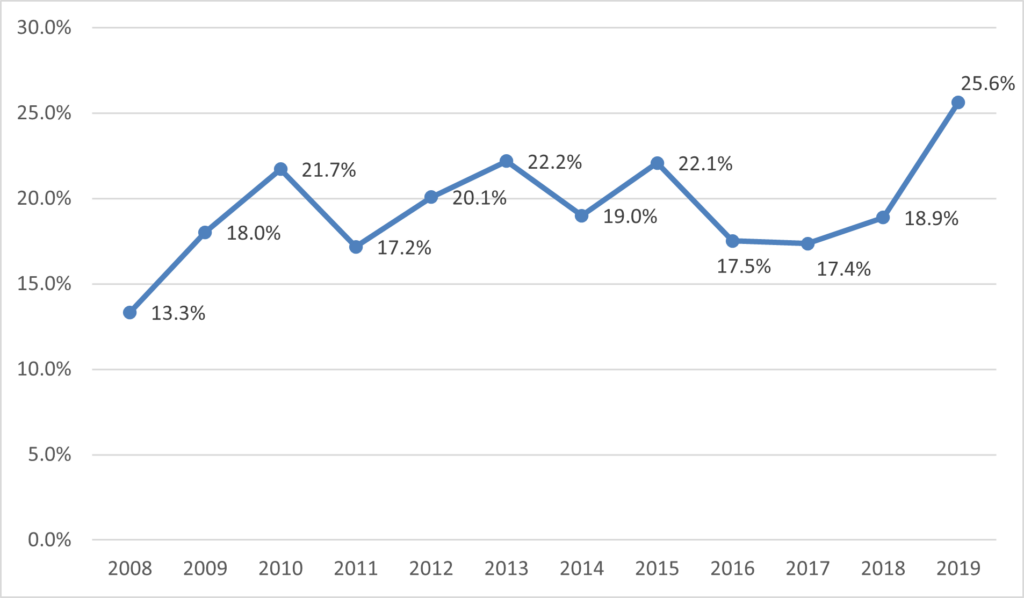
Overall, the reversal rates have fluctuated between 17% and 22% from 2009 to 2019. However, the rate increased to a peak of 25.6% in 2019, which translates to the IP Court revoking one in every four appealed cases that year.
Reversal rates for appellants in the second instance in all civil litigation cases closed from 2008 to 2019
 Source:Judicial Yuan
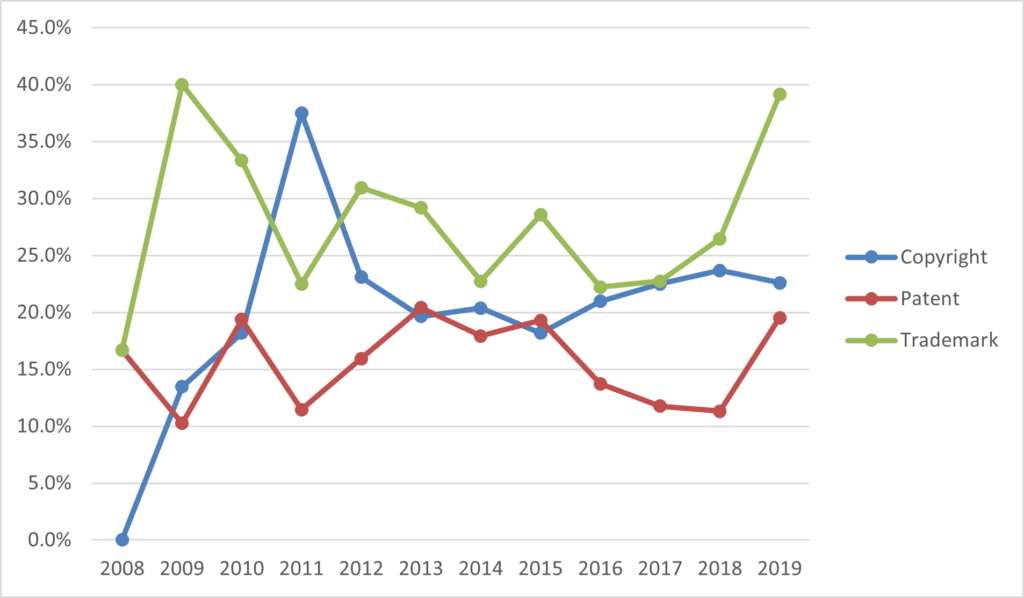
Observing the reversal rates for copyright, patent and trademark cases separately, no clear trend is apparent. However, from 2016 through 2019, the trend appears to indicate that reversal rates in patent cases are lowest, followed by copyright cases, then trademark cases with the highest reversal rates. This trend is similar to what has been seen for plaintiff win rates above. In 2019, trademark litigation cases had a reversal rate of 39.1% in the second instance, while the rate for copyright and trademark litigation cases were 22.6% and 19.5%, respectively.
Reversal rates for appellants in the second instance in copyright, patent and trademark cases closed from 2008 to 2019
| Copyright | Patent | Trademark | |
| 2008 | 0.0% | 16.7% | 16.7% |
| 2009 | 13.5% | 10.3% | 40.0% |
| 2010 | 18.2% | 19.4% | 33.3% |
| 2011 | 37.5% | 11.5% | 22.5% |
| 2012 | 23.1% | 15.9% | 31.0% |
| 2013 | 19.6% | 20.4% | 29.2% |
| 2014 | 20.4% | 17.9% | 22.7% |
| 2015 | 18.2% | 19.3% | 28.6% |
| 2016 | 21.0% | 13.7% | 22.2% |
| 2017 | 22.5% | 11.8% | 22.7% |
| 2018 | 23.7% | 11.3% | 26.5% |
| 2019 | 22.6% | 19.5% | 39.1% |
Source: Judicial Yuan
Settlement rate
Lastly, we turn to settlement rates at the IP Court. The rate of settlement for all civil litigation cases has been dropping since 2008, from more than 30% of cases being settled in 2008, to the lowest point of 7.46% in 2012. After 2013, the settlement rates have remained fairly steady at around 10%. The percentage of cases in 2019 in which settlement was achieved was 9.13%.
Settlement rates of all civil litigation cases closed from 2008 to 2019

Source: Judicial Yuan
Settlement rates in copyright, patent and trademark litigation cases have shown a downward trend since 2008. But from 2012, the rate has remained fairly steady at about 10%. Settlement rates in patent cases have been the lowest among the three major litigation categories being consistently under 10% from 2012 through 2019, and only 3.8% in 2018. The settlement rates for copyright and trademark cases were slightly higher at approximately 12% in the same period.
Settlement rates for copyright, patent and trademark litigation cases closed from 2008 to 2019
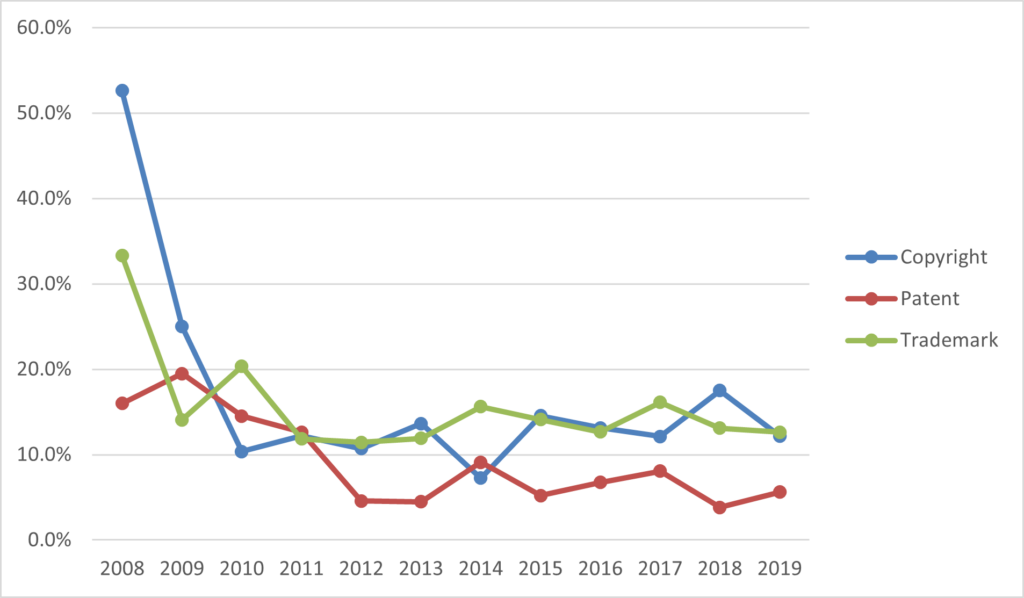
| Copyright | Patent | Trademark | |
| 2008 | 52.6% | 16.0% | 33.3% |
| 2009 | 25.0% | 19.5% | 14.1% |
| 2010 | 10.4% | 14.5% | 20.3% |
| 2011 | 12.2% | 12.6% | 11.8% |
| 2012 | 10.7% | 4.6% | 11.4% |
| 2013 | 13.6% | 4.5% | 11.9% |
| 2014 | 7.3% | 9.1% | 15.6% |
| 2015 | 14.5% | 5.2% | 14.1% |
| 2016 | 13.1% | 6.7% | 12.7% |
| 2017 | 12.1% | 8.1% | 16.1% |
| 2018 | 17.5% | 3.8% | 13.1% |
| 2019 | 12.2% | 5.6% | 12.6% |
Source: Judicial Yuan
The data in this part of the report provides insights into the outcomes of civil litigation cases before the IP Court as well as the different characteristics with regard to copyright, patent and trademark cases. For instance, it is apparent that win rates in patent cases are comparatively low, that it is more difficult to overturn a patent decision on appeal, and that few patent cases are settled. With regard to copyright cases, we can see that awards are comparatively smaller. In trademark cases, plaintiffs enjoy a higher win rate in the first instance, but face a greater likelihood of revocation in the second instance.
In part four of our report we will have a look at interesting statistics related to administrative litigation cases decided upon by the IP Court. You can find parts one and two here.
For more information on IP matters in Taiwan, please contact Gary Kuo at gkuo@winkerpartners.com.
*Sources: (1) Judicial Yuan (2) IP Court (3) DATA.GOV.TW.
*Note: Some of the figures provided in this report are calculated using raw data and may differ from those figures officially reported.
Written December 17, 2020 By Gary Kuo, Yi-Kai Chen.